chart
Table of Contents
Definition
chart command creates columnar data ready for a graph display, based on the incoming data.
Examples
You can use chart with aggregation functions.
%dpl
index=example
| chart count(_raw)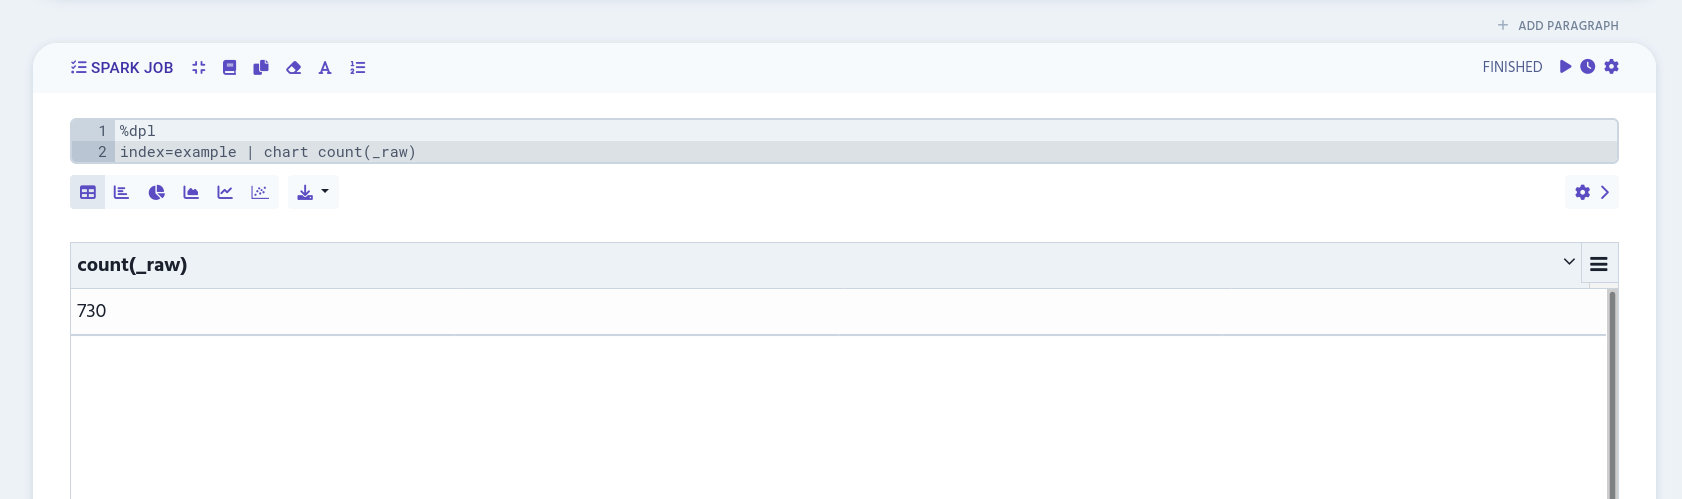
chart shows only one table column by default. Group your results with by to have more table columns visible at the same time.
%dpl
index=example
| chart sum(_raw) by _time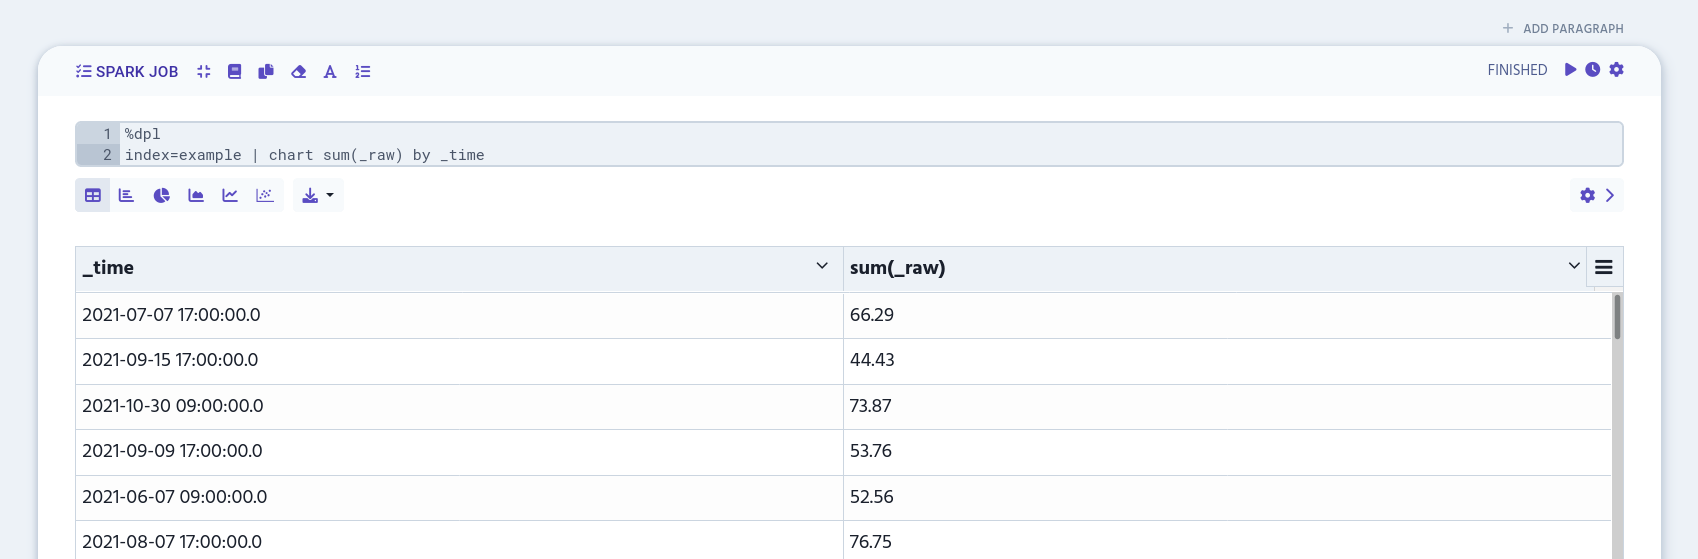
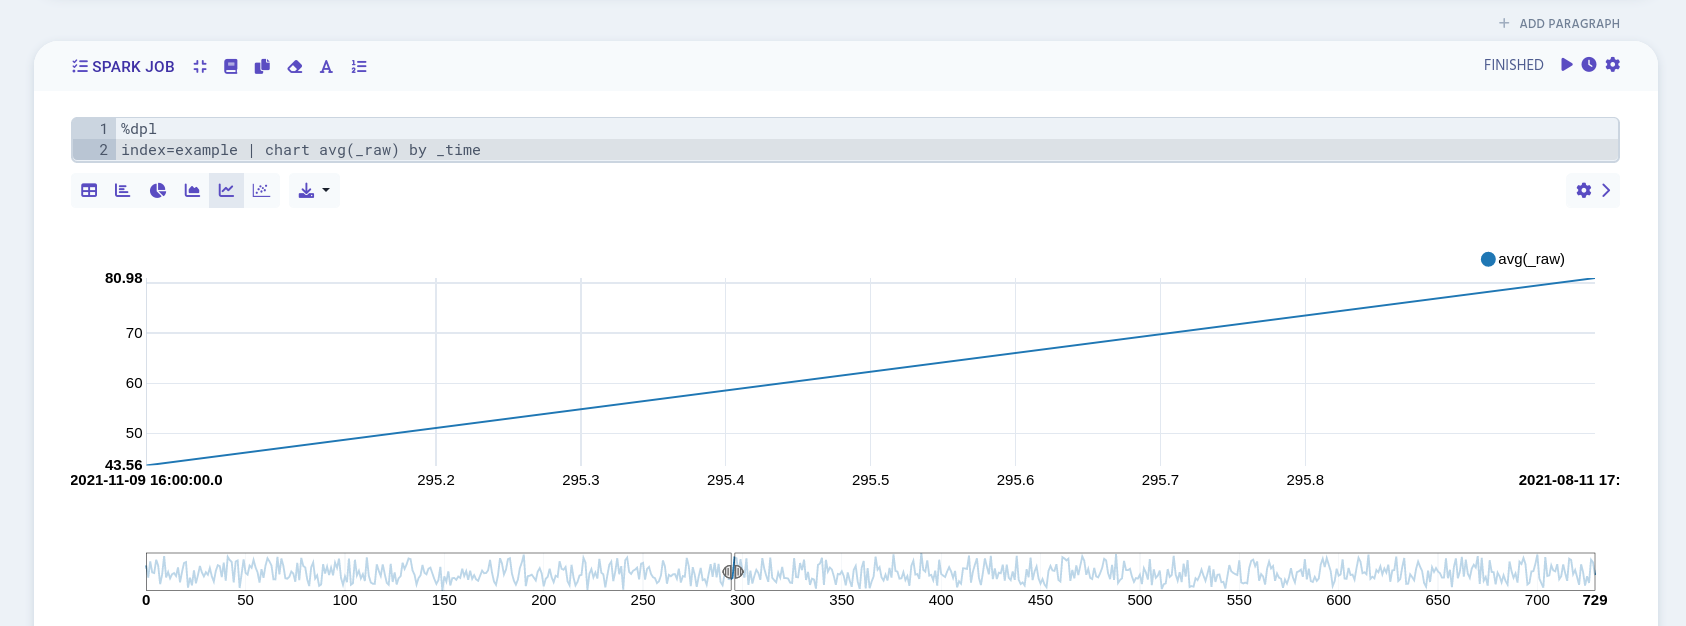
Switching between the graph options, you can convert the table data into a bar, pie, area, line or scatter chart.