timechart
Table of Contents
Definition
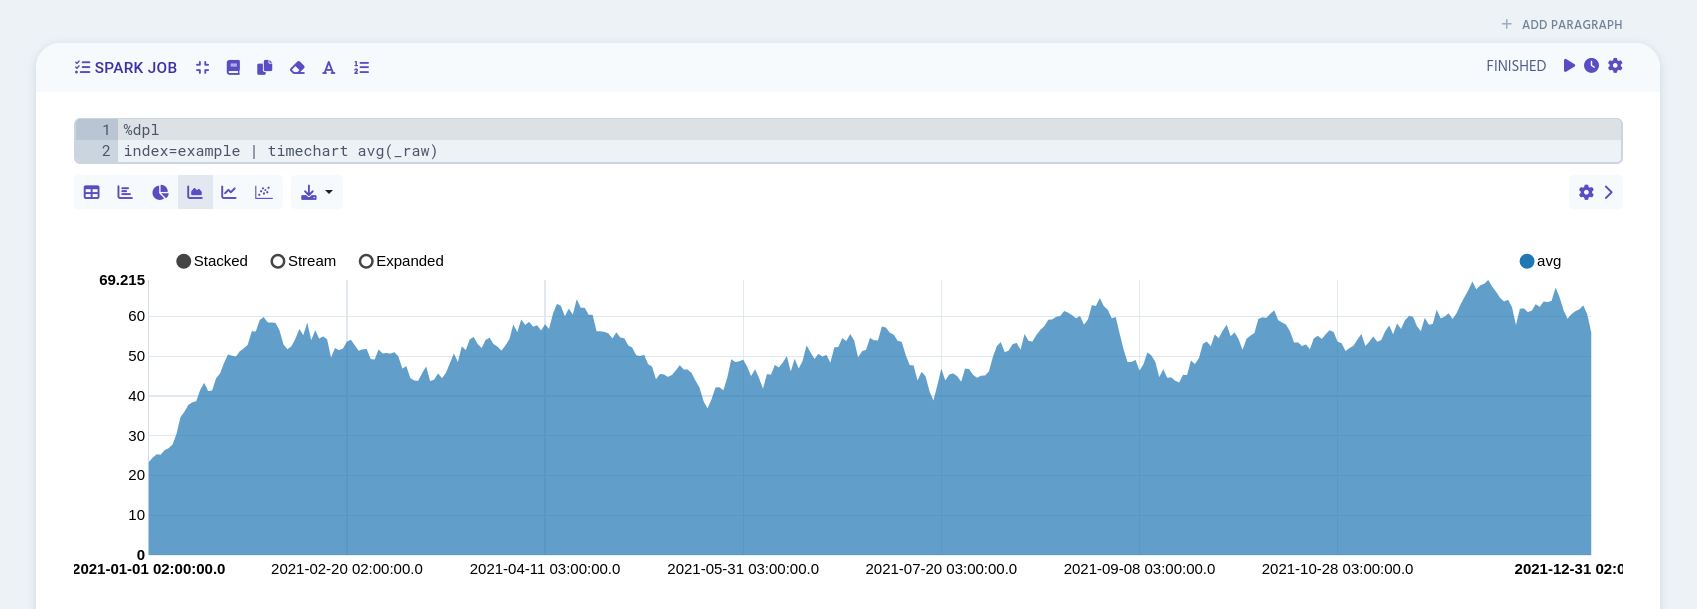
timechart command creates columnar data ready for graph display, based on the incoming data. It also groups the data by time windows with configurable window length (span).
Examples
You can use timechart with aggregation functions.
%dpl
index=example earliest=-3y
| timechart sum(_raw)
Convert the table data into a bar, pie, area, line or scatter chart by switching the graph options.
