Data Processing Language (DPL)
Teragrep’s Data Processing Language (DPL) is selected by entering %dpl on the paragraph’s code editor.
DPL functions can be divided in three categories: transforms, evaluations and aggregations. Transforms can be used as they are or with evaluations and aggregations. Evaluations can be used with eval, fieldformat and where transform functions. Aggregations can be used with chart, stats and timechart transform functions.
DPL uses ISO 8601 as the default time format and provides alternative default US time format for compatibility reasons.
Data Search
With DPL you can make data searches by using different kind of criteria. Read more here.
The simplest DPL search contains only the dataset’s name.
%dpl
index=example
You can use wildcards to search from multiple datasets at the same time. However, we don’t recommend doing index=* search since it’s prone to slow down the performance with big data masses.
To narrow down the results, you can add date range by using either earliest, latest or both.
|
At the moment, if the |
%dpl
index=example earliest=2020-01-01T00:00:00.000+03:00 latest=2021-12-01T00:00:00.000+03:00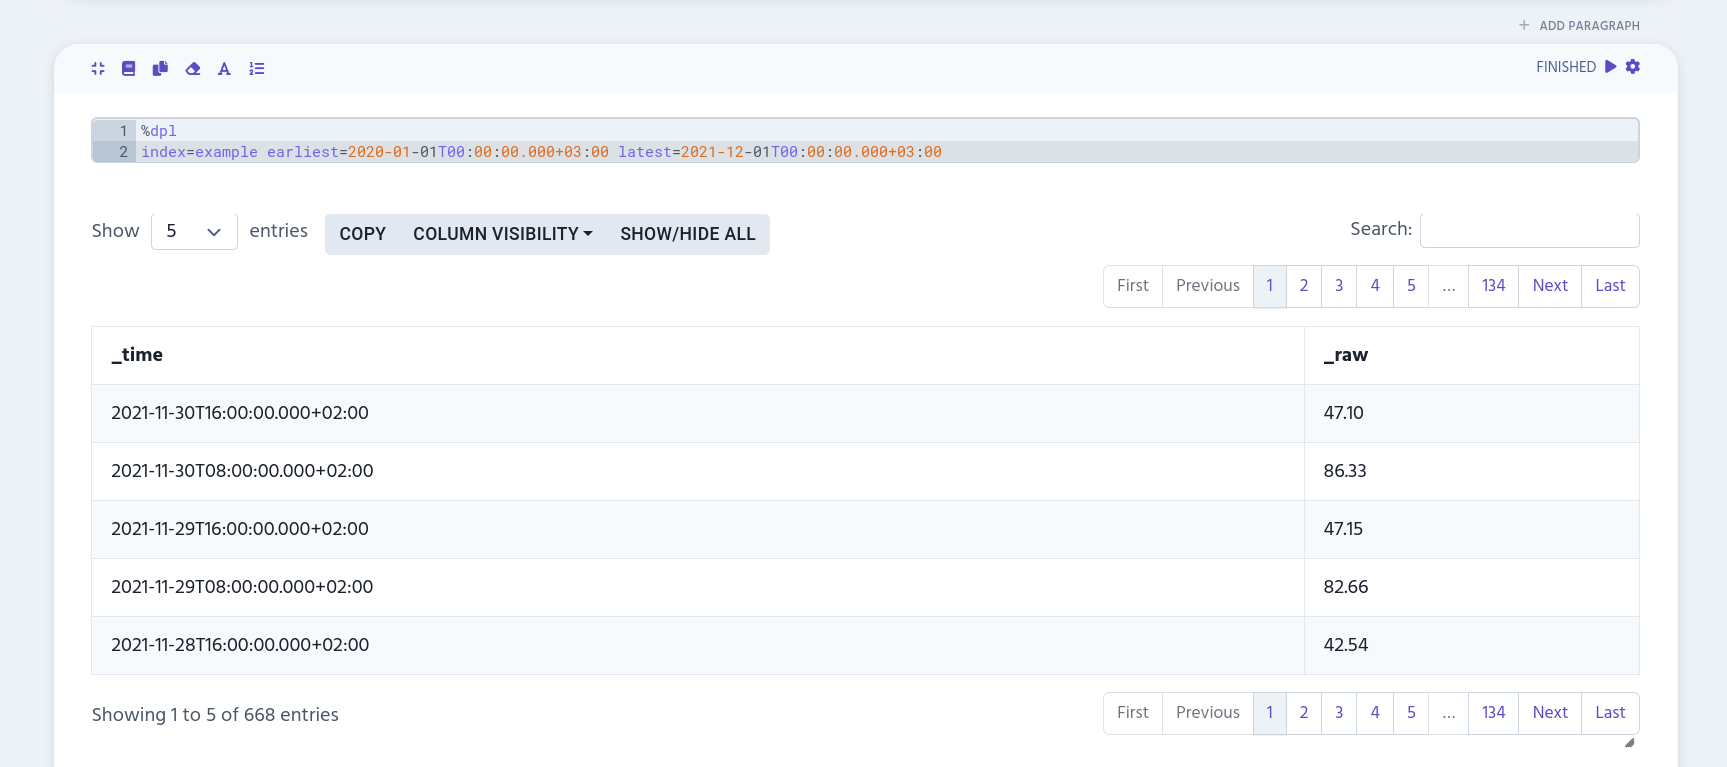
You can also add keywords to narrow down the results. The following example uses keyword 50 which will fetch all records that contain it in the _raw table column.
%dpl
index=example earliest=2020-01-01T00:00:00.000+03:00 50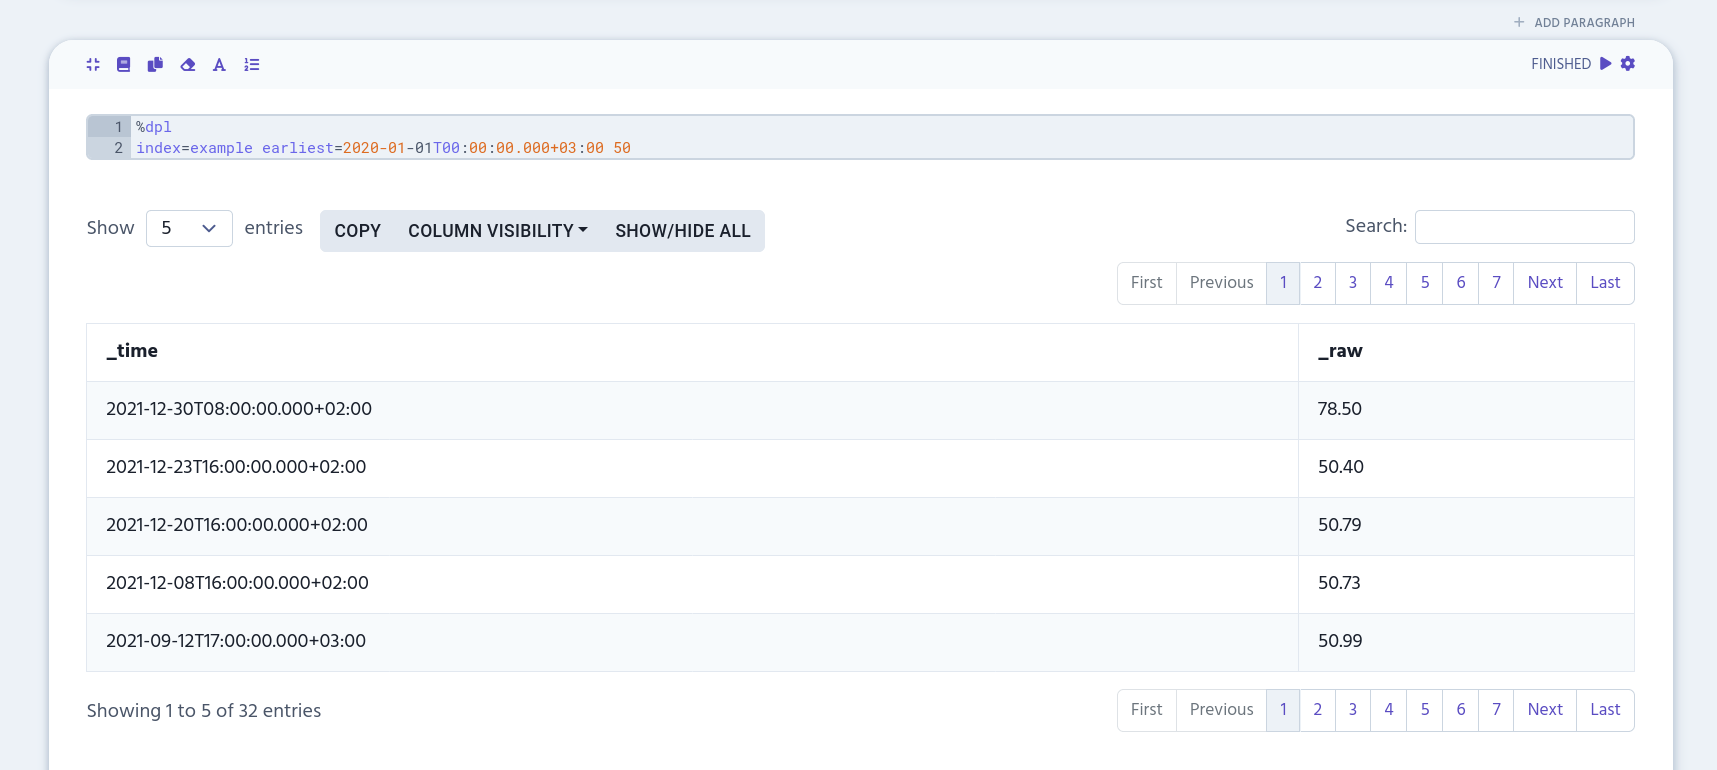
Pivot Tables
You can create pivot tables with chart, stats and timechart transform functions by using aggregations with them.
In the following example, we first search for all datasets that contains "join" in their names and limit the search to start 1.1.2021 at midnight. Then we used spath to extract JSON data from "success" and "operation" columns. As a last step, events in success and operation columns are counted with stats function.
%dpl
index=join* earliest=2021-01-01T00:00:00.000+03:00
| spath path=success
| spath path=operation
| stats count by success operation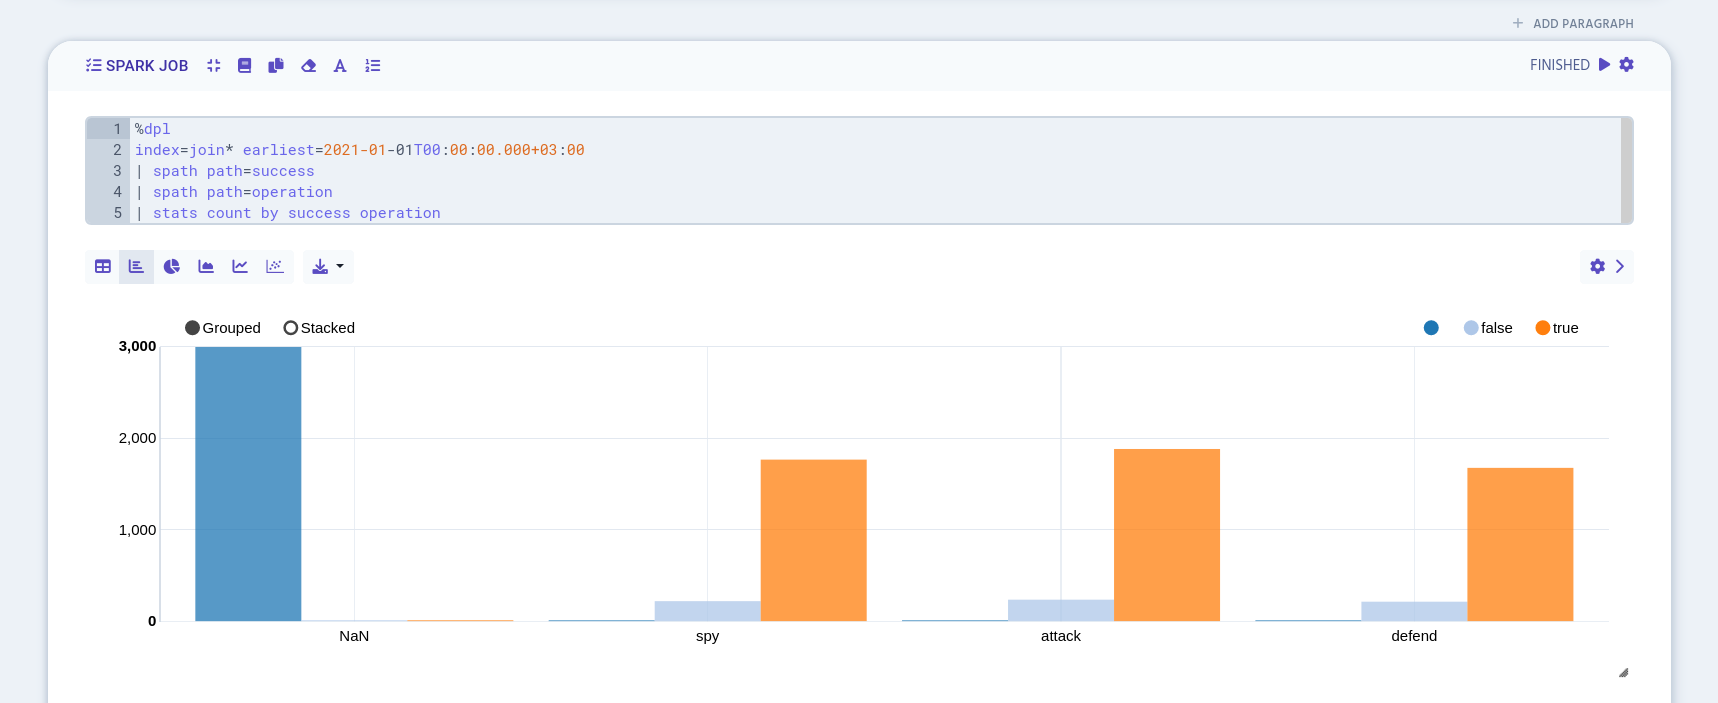
Read more here about how to use the pivot table.
Data output
DPL produces the data into a Spark Query named after the paragraph’s unique identifier. (You can see each paragraph’s identifier from the Paragraph Settings menu.) This output can then be processed with other interpreters that belong to the same interpreter group.