rangemap
|
This command is experimental |
Definition
Examples
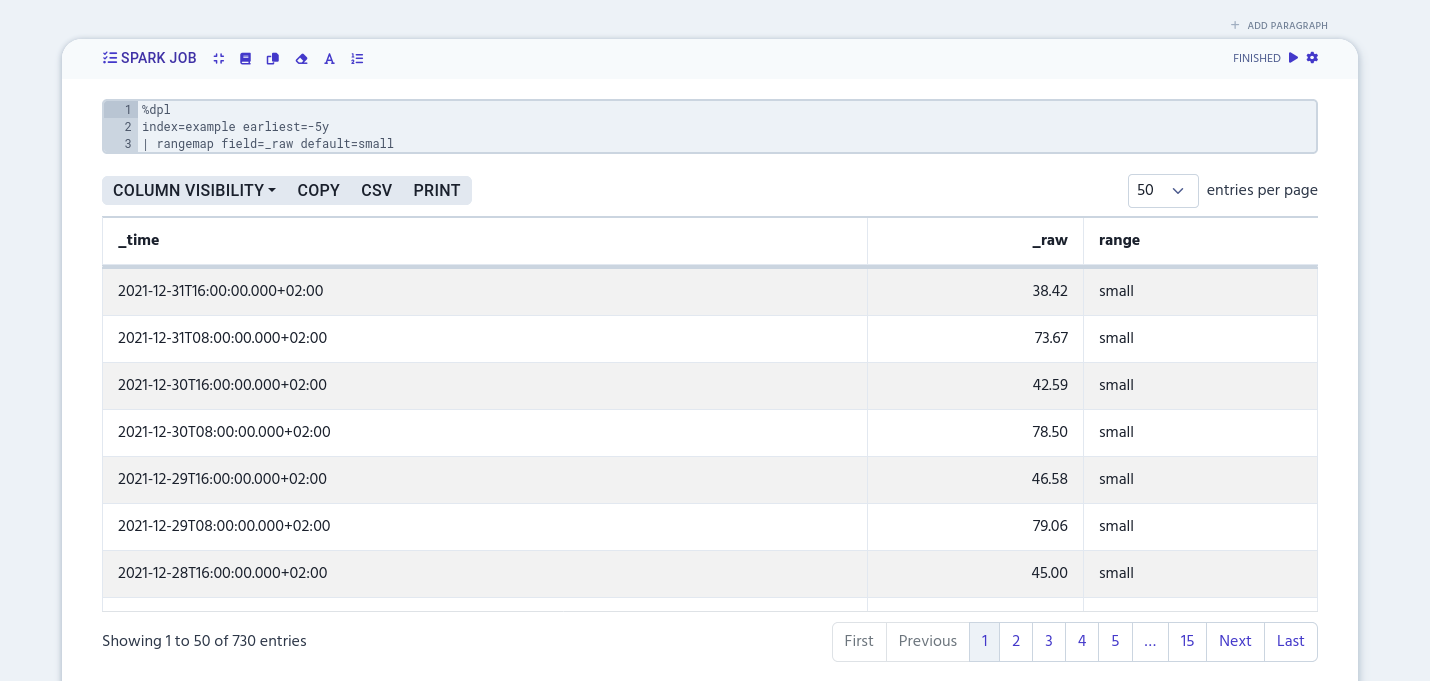
Use rangemap to add different labels to a certain numerical range values. The simplest example is to define labels to the certain column by naming the column, like in the following example.
%dpl
index=example earliest=-5y
| rangemap field=_raw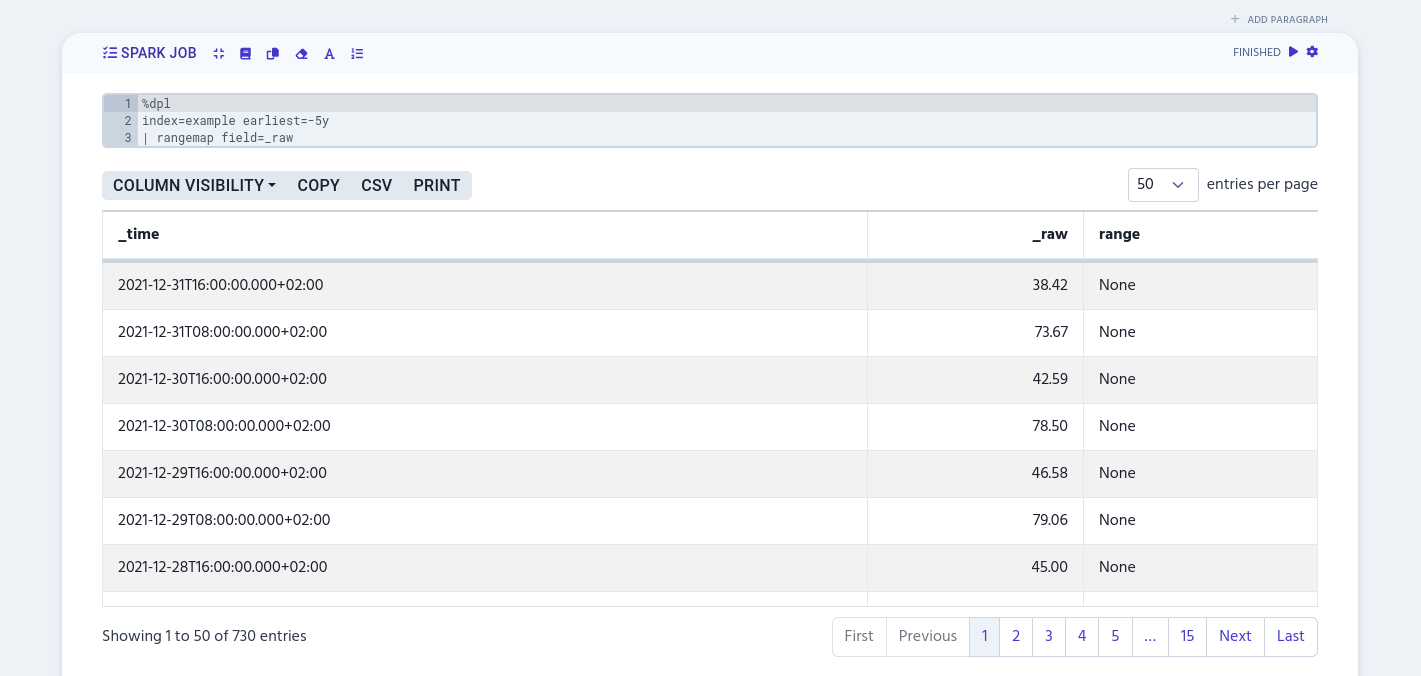
Attribute name
You can define different labels to a certain numerical range value with the attribute name argument. It’s a key-value-pair that looks like this:
<attribute-name>=<numeric-range>The first part before equal sign gives the name to the numerical range value. The second part after the equal sign defines the numerical range.
The following example adds 'low' label to values between 30 and 50, 'medium' to 50.1–70 range, and 'high' to 70.01–100.
%dpl
index=example earliest=-5y
| rangemap field=_raw low=30-50 medium=50.01-70 high=70.01-100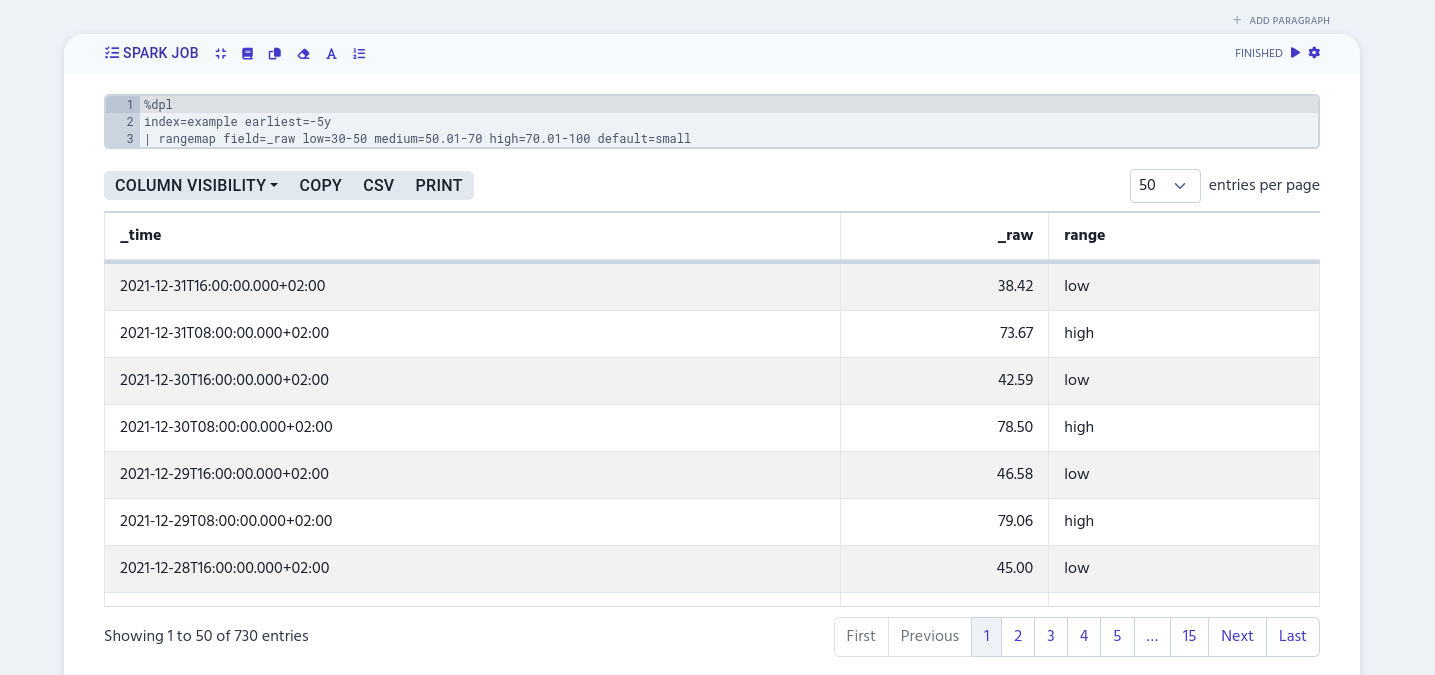
|
Currently, |
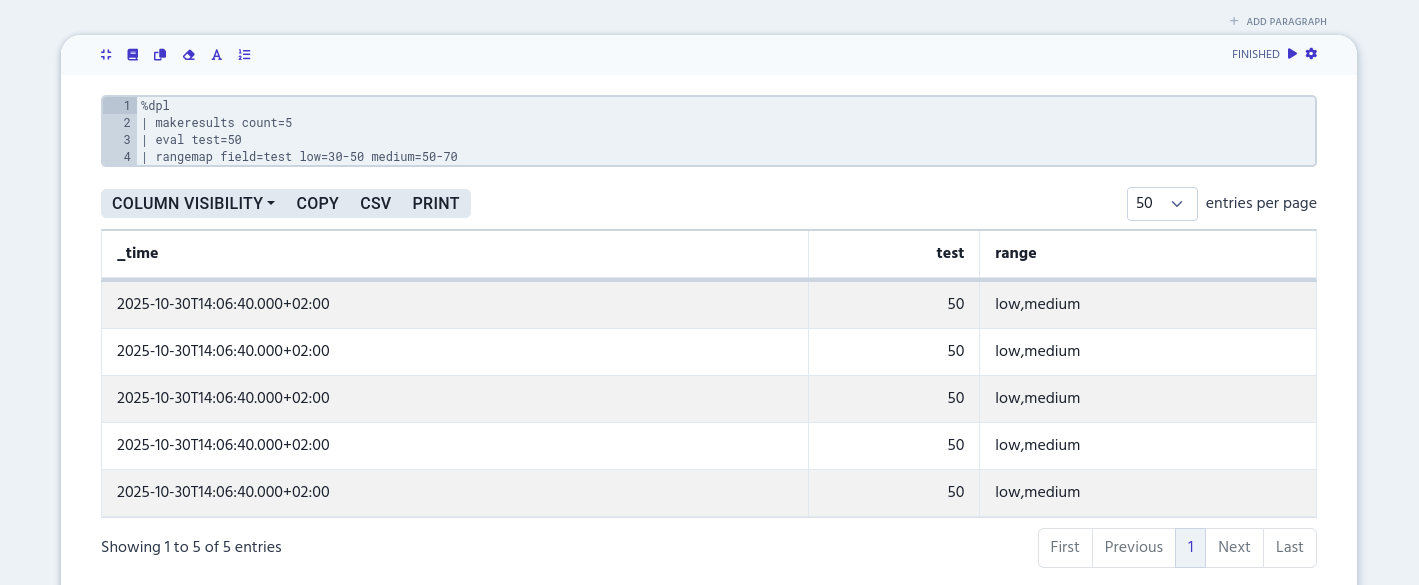
If the value matches with multiple ranges, the 'range' column will be created as a multivalue column. It will contain all the labels that match with the numeric range values. In the following example, there’s two matches with value '50' and that’s why it gets both 'low' and 'medium' labels.
%dpl
| makeresults count=5
| eval test=50
| rangemap field=test low=30-50 medium=50-70