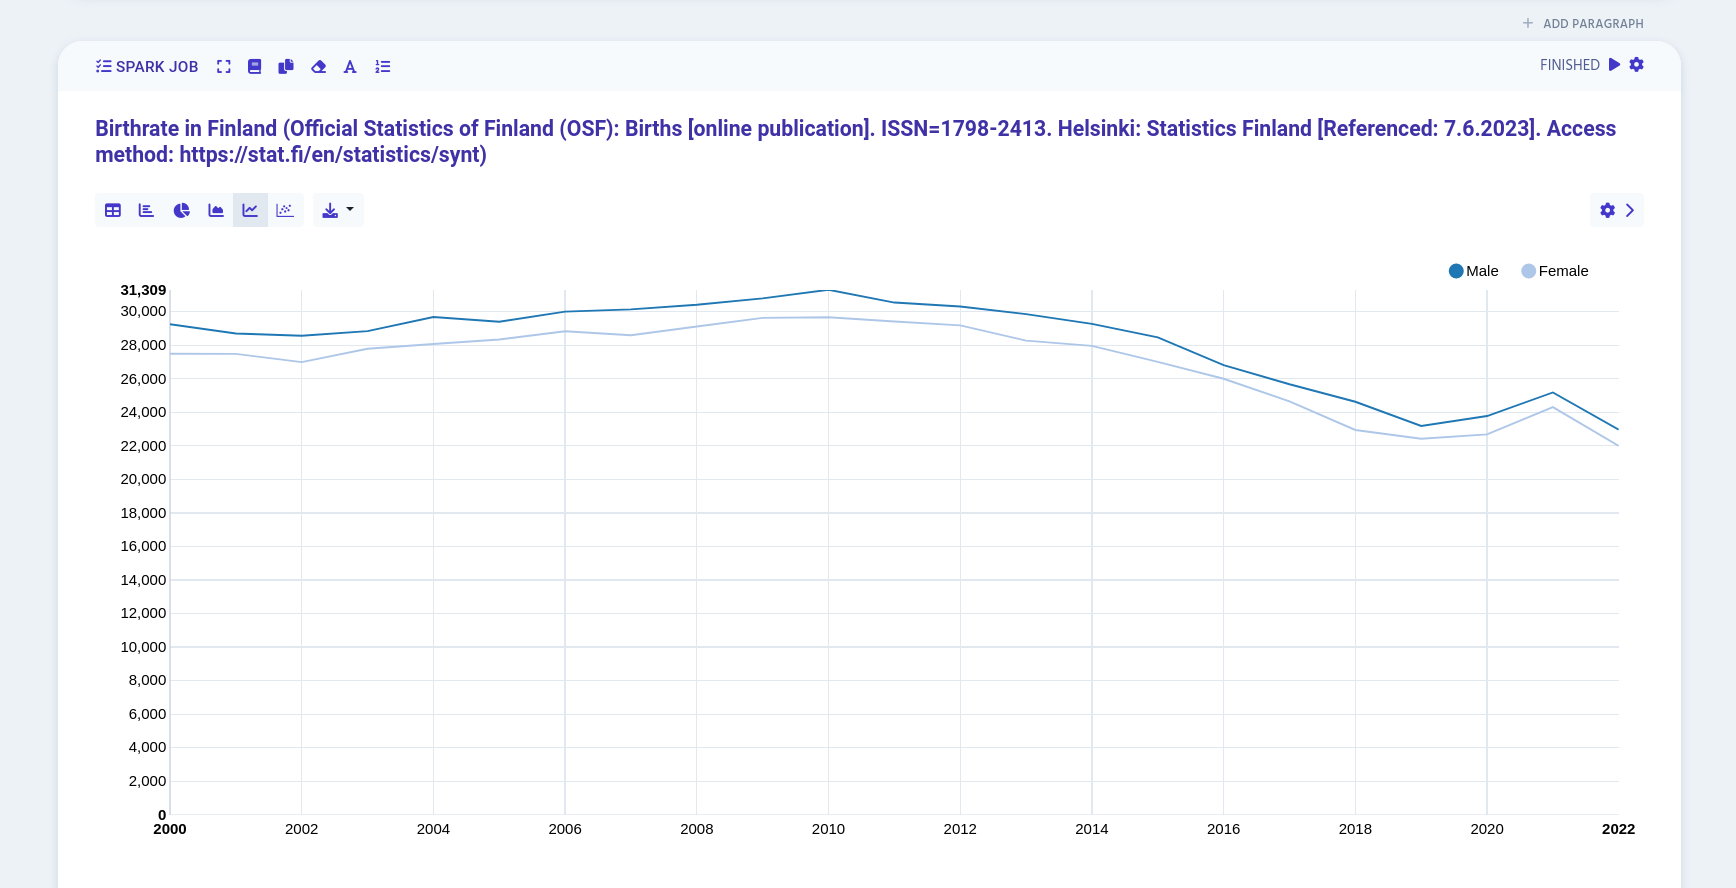
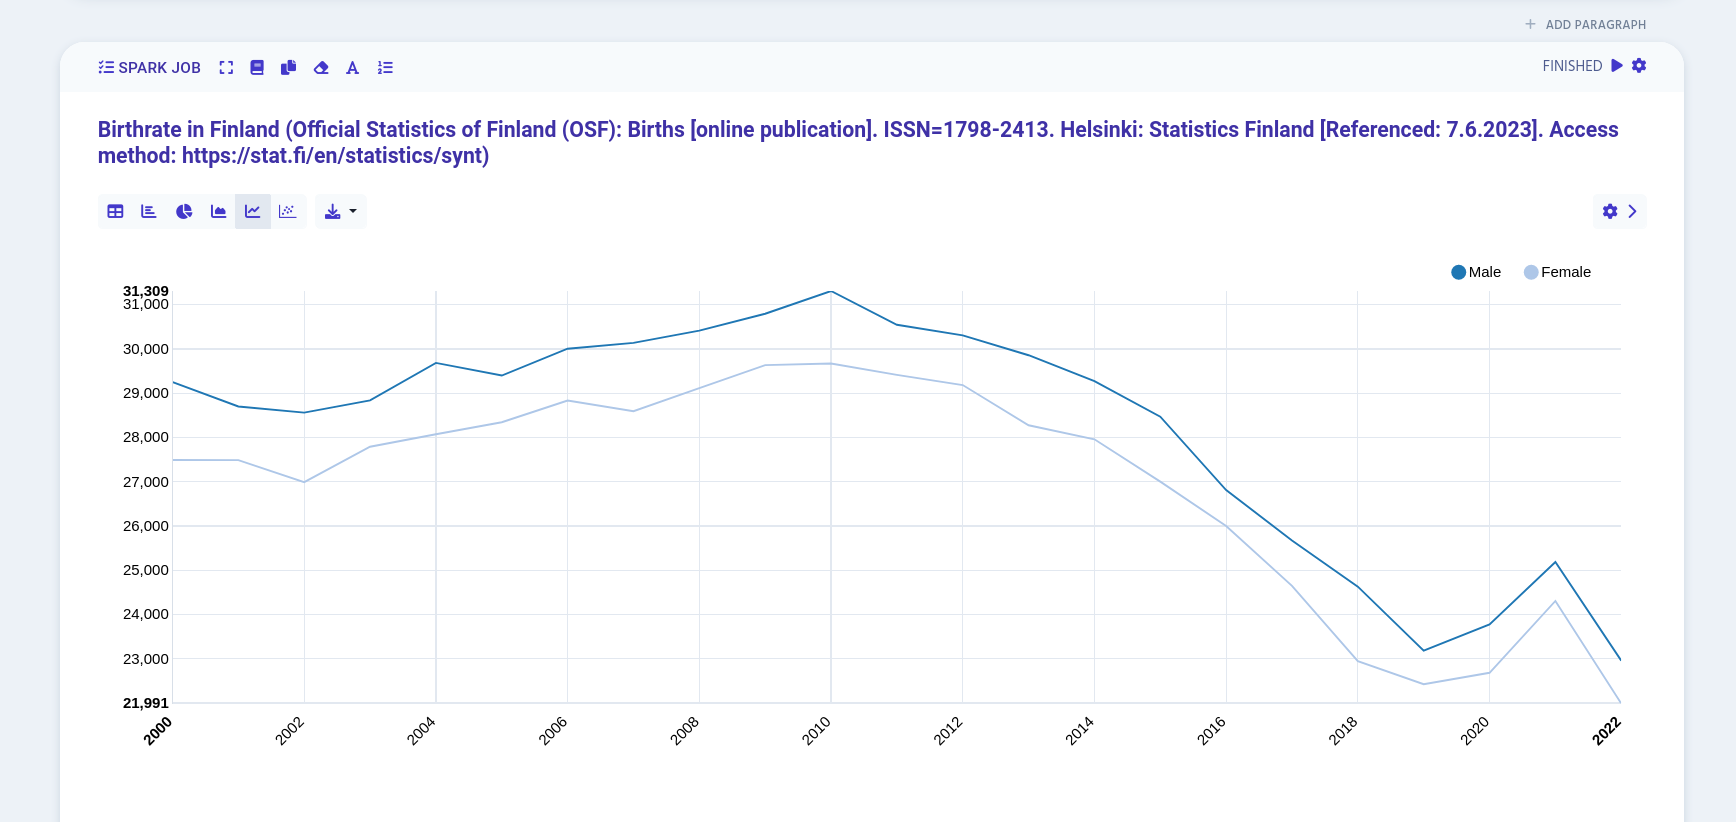
Line Chart
Table of Contents
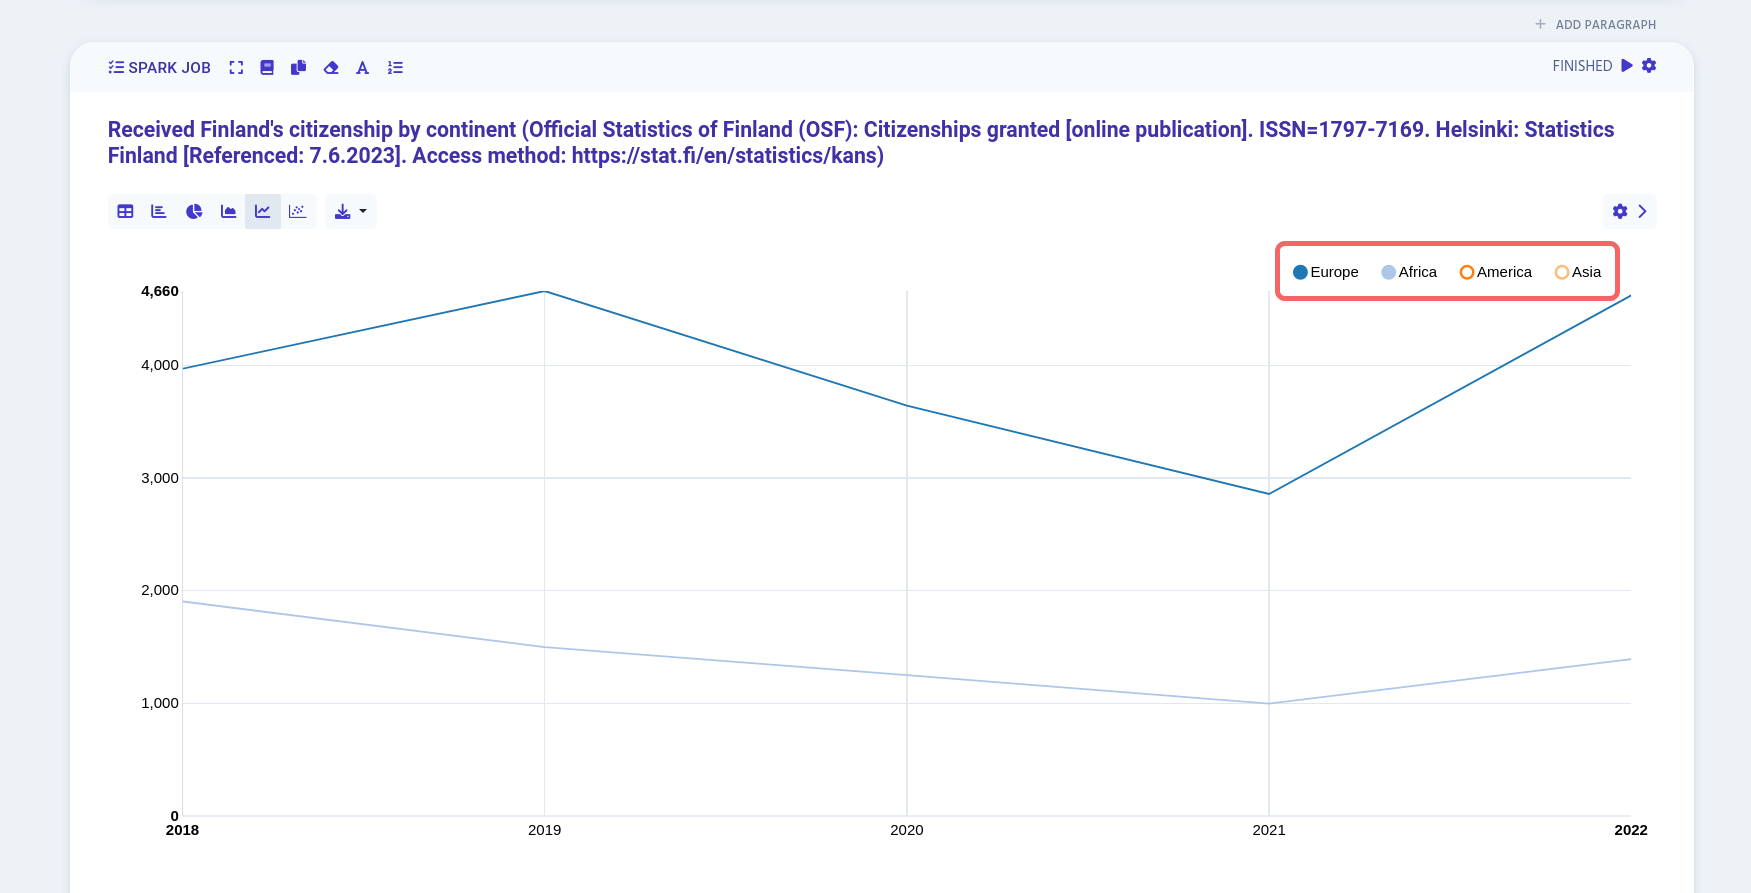
In line chart view the data is automatically generated into a line chart.
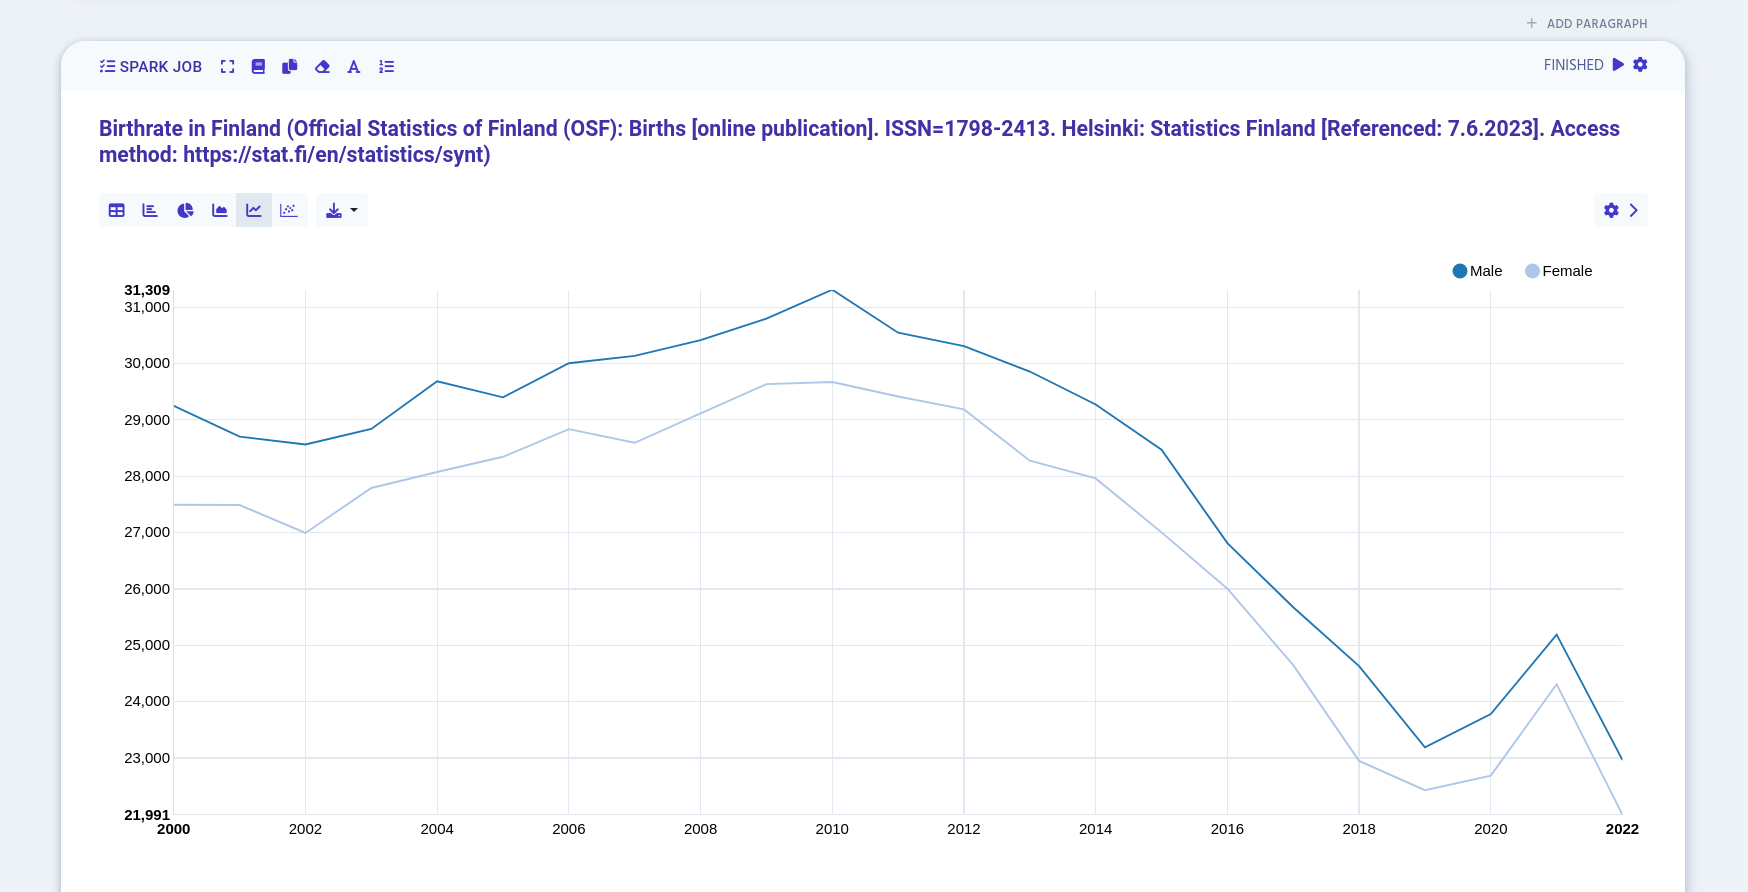
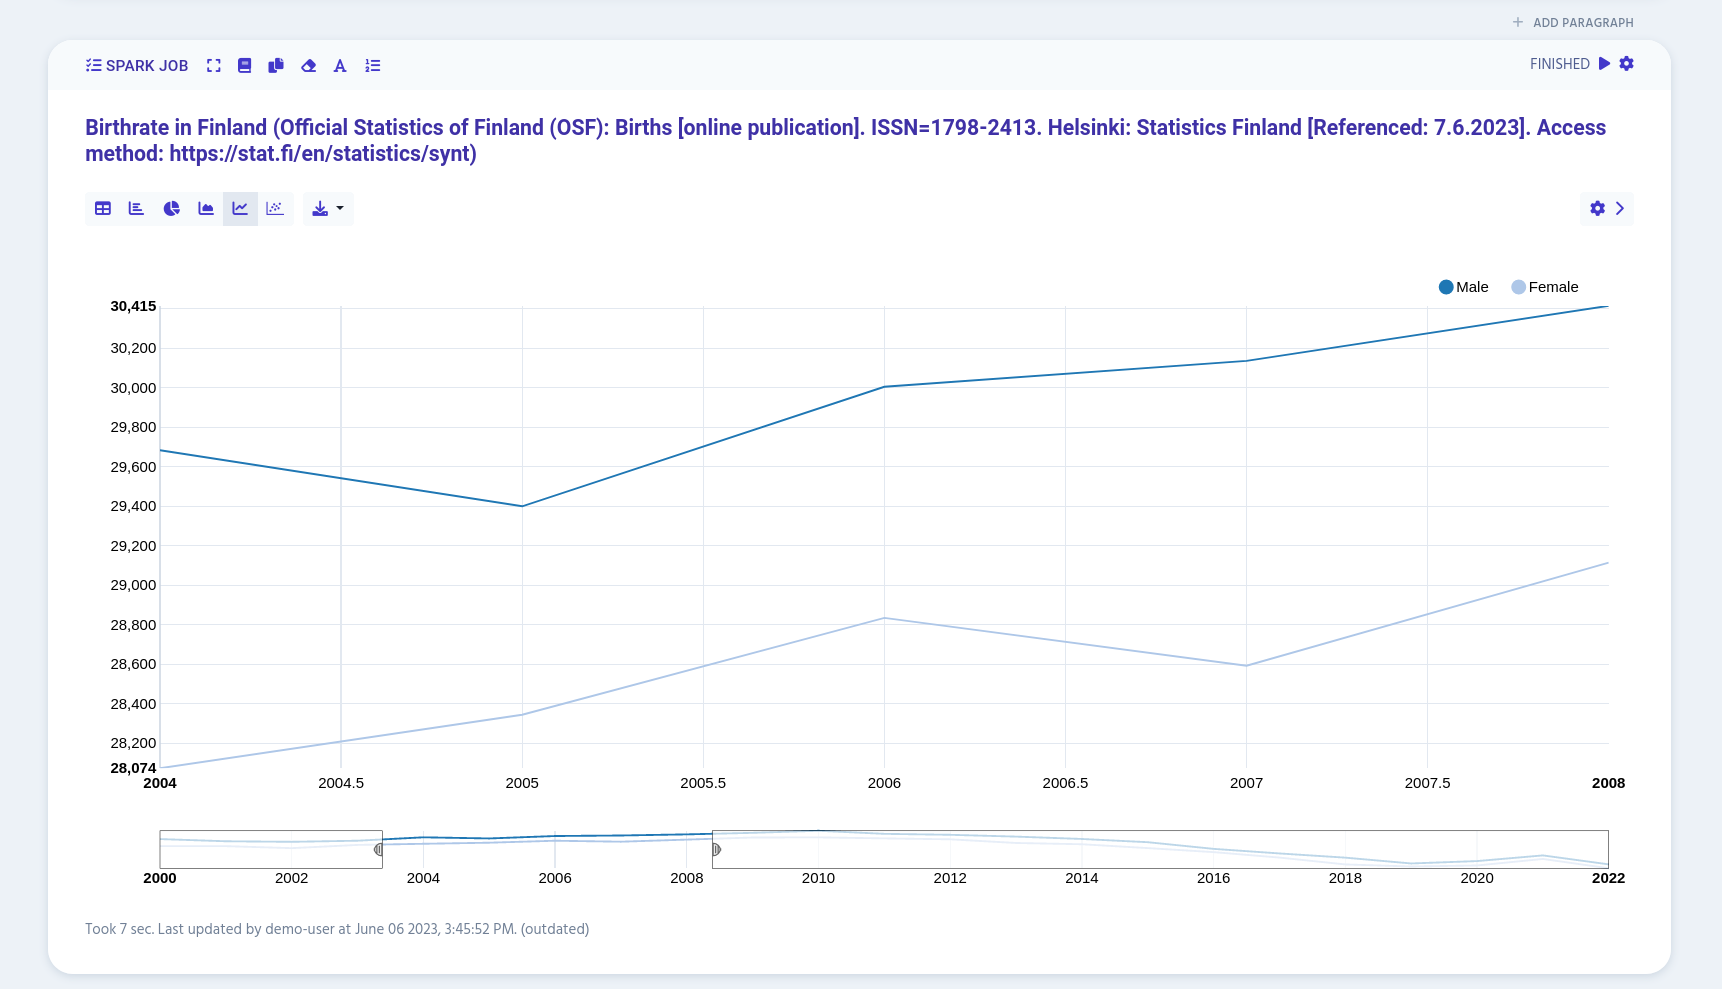
You can view exact values by hovering the line chart.
Settings
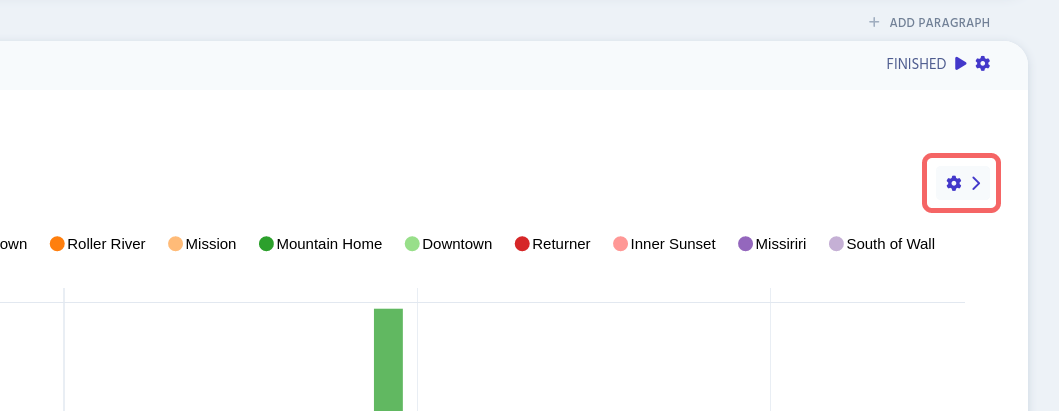
You can open table settings by clicking the cog icon on the right edge.
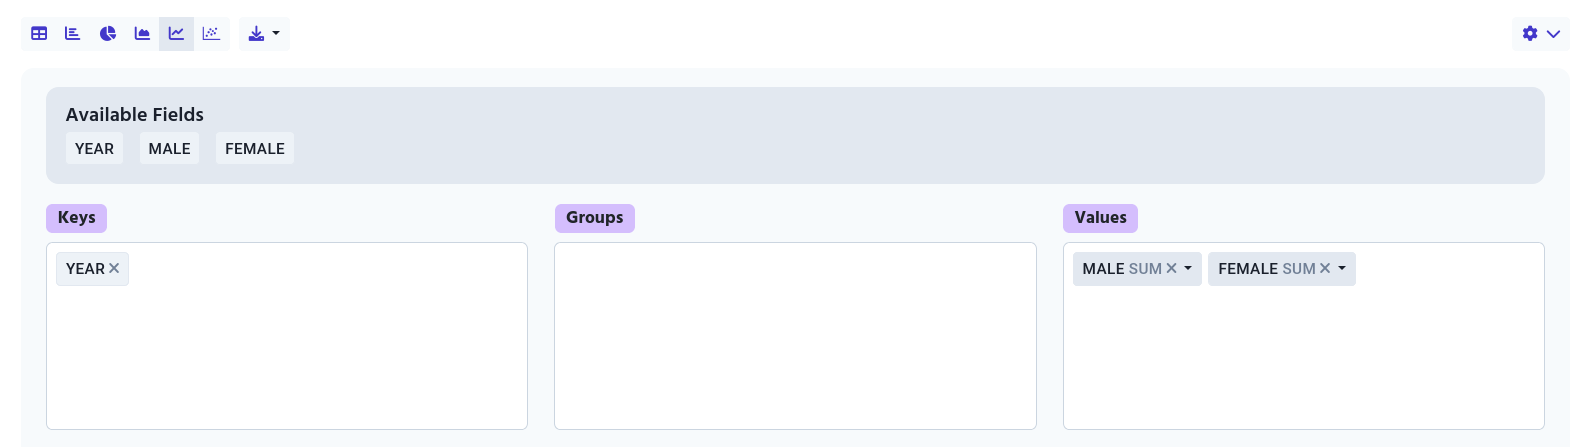
Arranging Data
In line chart settings there are three available fields:
-
Keys
Defines which values are shown on x-axis
-
Groups
Groups x-axis labels
-
Values
Add either
sum,count,avg,minormaxto selected values
You can freely drag and drop different values to different fields to change the line chart’s appearance.
Adjusting Axes
On below data arranging settings you can affect in axes' appearance.
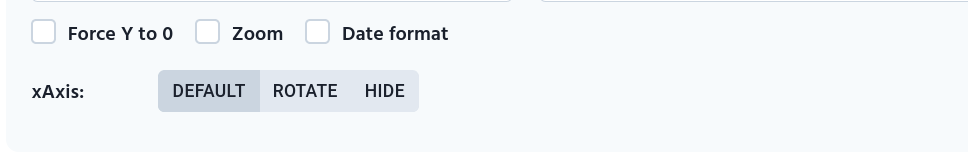
Force Y to 0
By default the graph shows the lowest value in the dataset as starting value on y-axis. When Force Y to 0 is enabled, y-axis shows 0 as the lowest value.